


Even experienced digital marketers can make mistakes when looking at data and making decisions. Here are 10 to watch out for.
Reporting and data analysis inevitably encompass a significant amount of our time as digital marketers.
However, even experienced marketers can trip up and make a few common mistakes when looking at data and making decisions.
You need to stay mindful of errors that can result in looking at the wrong data, reaching the wrong conclusions, or leaving the door open for faulty interpretations from a client or boss.
In this article, you’ll learn 10 common mistakes digital marketers make when analyzing data:
- Not looking at a statistically significant timeframe.
- Not factoring in seasonality.
- Ignoring the impact of offline activity.
- Not accounting for multi-channel engagement.
- Reporting on numbers without conclusions.
- Focusing on the wrong KPIs.
- Making decisions based on faulty data.
- Not incorporating backend data.
- Visualizing data poorly.
- Assuming that you can measure everything.
1. Not Looking at a Statistically Significant Timeframe
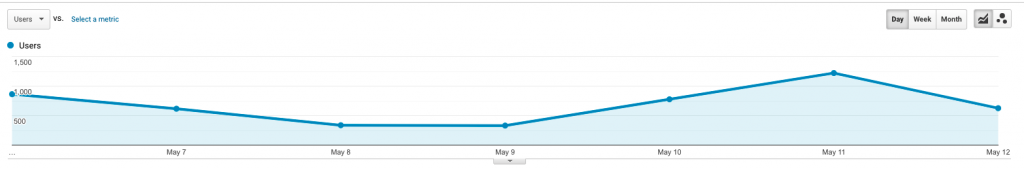
Many businesses see ebb and flow in lead volume over the course of a week or month, and looking at data for just a few days generally does not yield an accurate reflection of long-term ROI.
If your goal is to generate an average of 100 qualified leads a month, you could accomplish that goal by receiving 10 leads one week and 30 leads for each of the next three weeks.
Very few businesses will see the exact same number of leads coming through every single day or week.
If you were to judge projected performance just based on the first week alone, you might assume that lead volume is abnormally low. However, the account still reached the goal of 100 leads/month with future weeks picking up in volume.
Many business owners and CMOs are (understandably) tied to the numbers and monitoring daily/weekly results.
Marketers should help provide the wider context to minimize fears around the numbers being down for the day when sales are up for the month.
2. Not Factoring in Seasonality
Another part of considering timeframes is to keep seasonality factors in mind.
An ecommerce business will likely see its biggest sales period around Black Friday, while a B2B business may see lead volume slump around the holidays.
Data from past years can be helpful in order to factor in which months tend to have the highest and lowest volume.
You should factor in data directly from Google Analytics and ad platforms, as well as overall backend sales/lead data.
3. Ignoring the Impact of Offline Activity
Unfortunately, we’re probably all familiar with “unprecedented events” that can impact businesses globally. Graphs for the vast majority of businesses don’t follow “normal” patterns when looking back at 2020.
Outside of the events of 2020, many companies see their business ebb and flow based on outside factors.
An HVAC business will likely see inquiries pick up when weather trends toward extreme heat or cold, for example. A SaaS business may see an uptick in interest when its biggest competitor raises prices.
Keep tabs on any news and events that may indicate the potential for either increased business interest or reduced inquiries.
Unfortunately, a business may also encounter negative press, which may adversely affect the overall likelihood of people wanting to purchase.
A brand doing traditional advertising should also look for the impact in brand search activity and overall lead metrics when running a TV ad. Offline advertising can often impact users to turn to their devices to engage further with a brand.
4. Not Accounting for Multi-Channel Engagement
Marketers can become extremely tied to watching a particular channel — whether that’s organic search, paid search, Facebook advertising, or LinkedIn advertising — and obsessing over getting that channel to work.
However, no channel operates entirely in a silo, because no web user strictly utilizes a single channel.
Unfortunately, analytics and ad platforms that default to last-click attribution often exacerbate this problem.
Marketers look strictly at the final source and campaign that drove a lead, without factoring in that a user may have conducted a non-branded search, clicked a Facebook ad, and then conducted a brand search before finally converting.
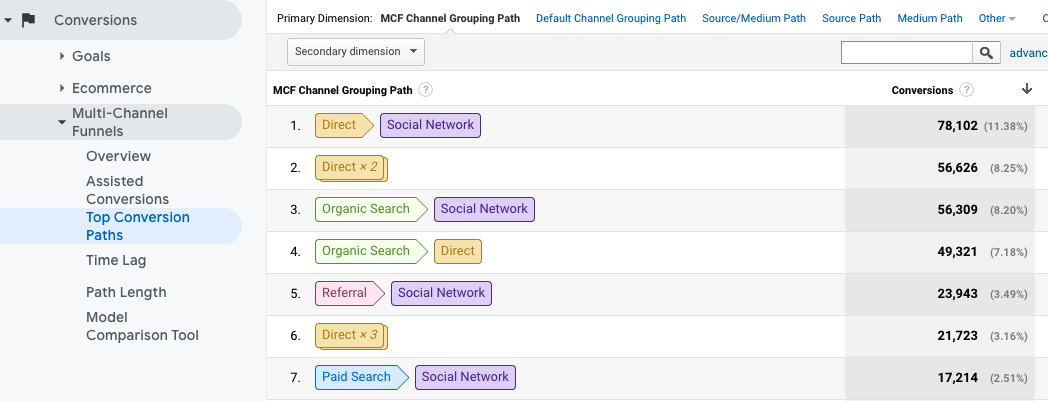
To make a move away from a purely last-click mindset, pay attention to assisted conversions and conversion paths in the Multi-Channel Funnels section of Google Analytics.
In addition, use the Attribution section of Google Ads to compare different attribution models.
5. Focusing on the Wrong KPIs
You’ve assembled what you consider to be the perfect digital marketing report. Conversions and conversion rate are up, and cost/conversion is down. Your campaigns are crushing performance metrics.
Excited to share the news with your client, you breathlessly launch into talking about the report, while your client takes their first look at the results.
But before you can say two words, your client interrupts with questions: “Why is our bounce rate up? Why is CTR down?”
Before you know it, the conversation derails away from the positive conversion stats that you hoped to place focus on.
Digital marketers have a responsibility to focus on the metrics that relate most directly to the business bottom line, but secondary metrics can quickly distract from the ultimate goals of a campaign.
Both in your own optimization work and in reporting to clients or bosses, be sure to place primary focus on the metrics that matter most (marketing qualified leads, sales, etc.) over surface metrics like CTR, bounce rate, CPC, etc.
While you shouldn’t ignore metrics like CTR when there are rapid changes, you also shouldn’t place primary emphasis on optimizing toward secondary metrics.
6. Reporting on Numbers Without Conclusions
In addition to reporting on the right KPIs, you need to communicate why you’ve chosen those KPIs and what story they tell.
If your reports are just tables of numbers and graphs without any context, your client or boss is left to draw their own conclusions.
For instance, instead of just saying that conversions are up, point out that the Spring Sale campaign you’ve been running for the last two weeks has helped increase the conversion rate by 5%. Talk about what ad creative worked best.
Showing your learnings from the campaign can accompany commentary on what creative and targeting the brand should test for the next sale based on what worked this round.
If performance is down, talk about factors such as seasonality or offline events that may help explain the drop. Providing context can help relieve concern around a dropping graph line.
7. Making Decisions Based on Faulty Data
Before starting any data analysis, make sure that your Google Analytics configuration, ad platform conversion tracking, and any other tools you’re referencing are set up and measuring data properly.
You may end up underreporting conversions if a pixel isn’t firing properly on a Thank You page. Or, you might overreport results if a conversion rule is set up for the wrong page.
In addition, establish a system to regularly check that data is flowing properly. For instance, a developer may have updated a site and dropped off the tracking codes in the process, or a client may have changed a page URL without notifying you.
Ideally, make sure your client or development team knows to notify you before any changes roll out.
8. Not Incorporating Backend Data
I work with several B2B clients who have lengthy sales cycles, frequently entailing multiple touchpoints before a closed deal.
While I may see the form submission tracked in Google Ads, I don’t know how the conversations between the individual and the sales team progressed. Just measuring the initial conversions doesn’t tell the full story.
Proper UTM tagging and attribution of sources in a CRM will allow you to measure how effectively leads move through the sales process after they’ve entered.
Ultimately, with the right setup in place, you should be able to attribute revenue back to a specific campaign, keyword, and ad.
On the ecommerce end, review backend sales data and compare it against what you’re tracking in ad platforms and Analytics.
You may identify sales or recurring customers that can be tied back to campaigns you’ve run, outside of what’s directly tracked in ad platforms.
9. Visualizing Data Poorly
Charts and graphs can greatly help complex sets of numbers make sense. However, a graph used carelessly can miscommunicate results.
For instance, look at the following pie chart showing conversions by month:
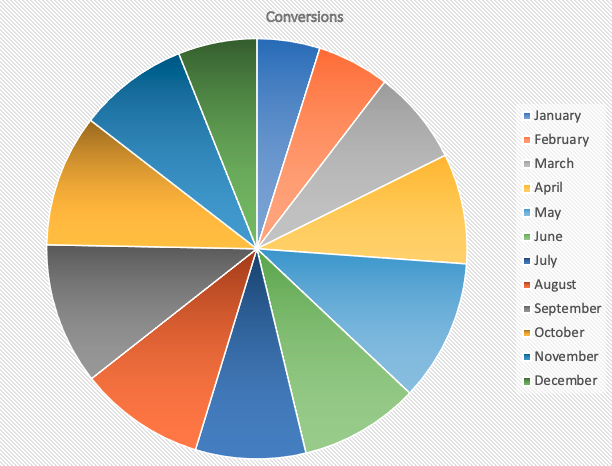
This format doesn’t tell you much, apart from being able to see that some pieces of the pie are slightly larger than others.
Without even having numbers to reference, the pie chart is less than ideal to represent how data has changed from month to month.
Conversely, see the line chart below:
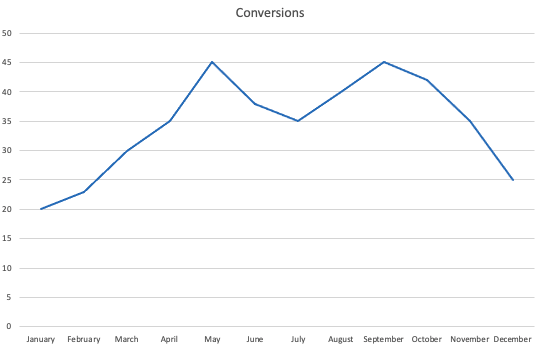
This chart allows you to see the approximate numbers for each month, as well as being able to track change over time. You can also pinpoint potential seasonal trends.
When using a graph or chart, think about the format that best tells the story you’re trying to communicate in your report.
10. Assuming That You Can Measure Everything
I know, you’re reading an article about data analysis because you want to be able to measure everything you can. But you just won’t always have perfect attribution and can’t always determine the exact ROI of every ad you run.
Going back to themes discussed earlier in this post, can you perfectly correlate exactly how much our recent dramatic world events have impacted sales for any particular business?
No, although you can certainly draw conclusions and find correlations based on data.
With continued restrictions from browsers and operating systems affecting tracking, will every conversion be accurately attributed to the right source? No.
While you should make every effort to set up tracking properly, you should also realize that no analytics infrastructure is ever going to represent performance in a 100% accurate way.
When making data-informed decisions, allow for nuance to step back and look at the bigger picture, including a review of overall marketing results along with those tied to specific channels.
Commit to Better Data Analysis
Now that you’ve reviewed these 10 common mistakes, think through your own processes of evaluating and reporting on data.
Are you looking at significant enough data?
Are you factoring in events outside of what’s tracked in your analytics and ad platforms?
Are you providing enough context for your reports?
Be mindful of these potential mistakes when working through making decisions for your campaigns, as well as when preparing reports.
As a result, you’ll be able to build better reports and have more effective conversations with stakeholders about where to go next after reviewing results.
___
by Tim Jensen
source: SEJ